Initialising the digital twin...
Research
The science behind BioVolt
Every number on this site traces back to a physical law or a published measurement. Here is the method, the validation, the honest limits and all 80 sources.
Model vs experiment
OCV 0.804 V vs 0.798 V
0
Coulombs per gram of COD
Faraday: 4 electrons per O₂, 32 g per mol
0.00 V
Theoretical cell voltage
Acetate to oxygen, Nernst
+0.0%
Energy from smart load control
10 simulated days, MPPT vs 1000 Ω
0
Papers, datasheets and standards
Every DOI linked below
Method
Three layers, one living cell
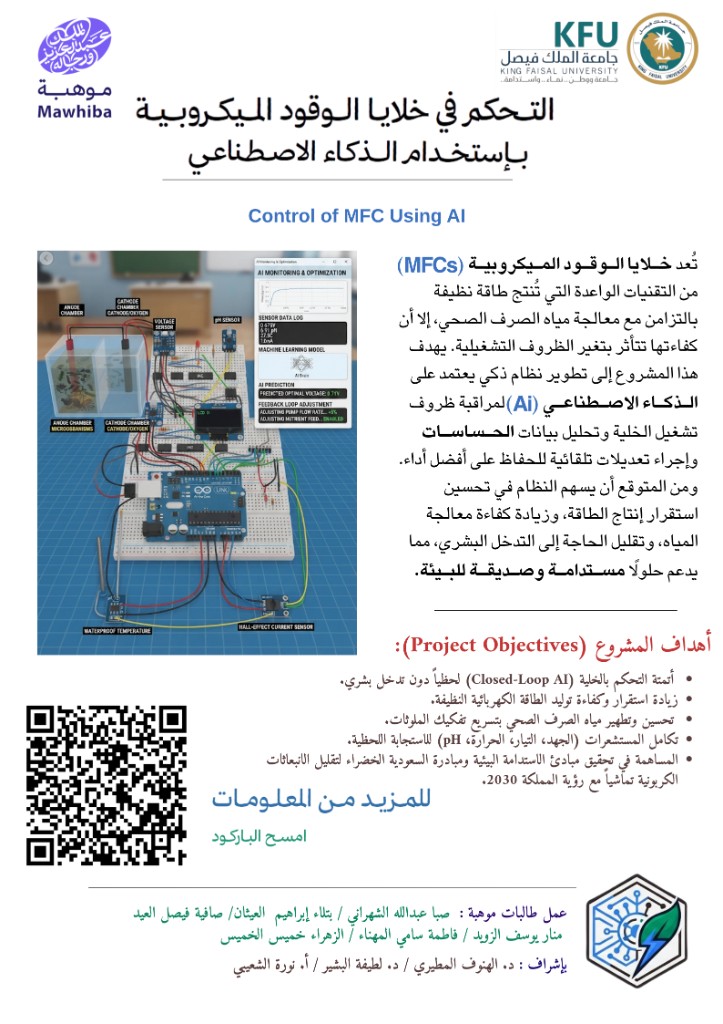
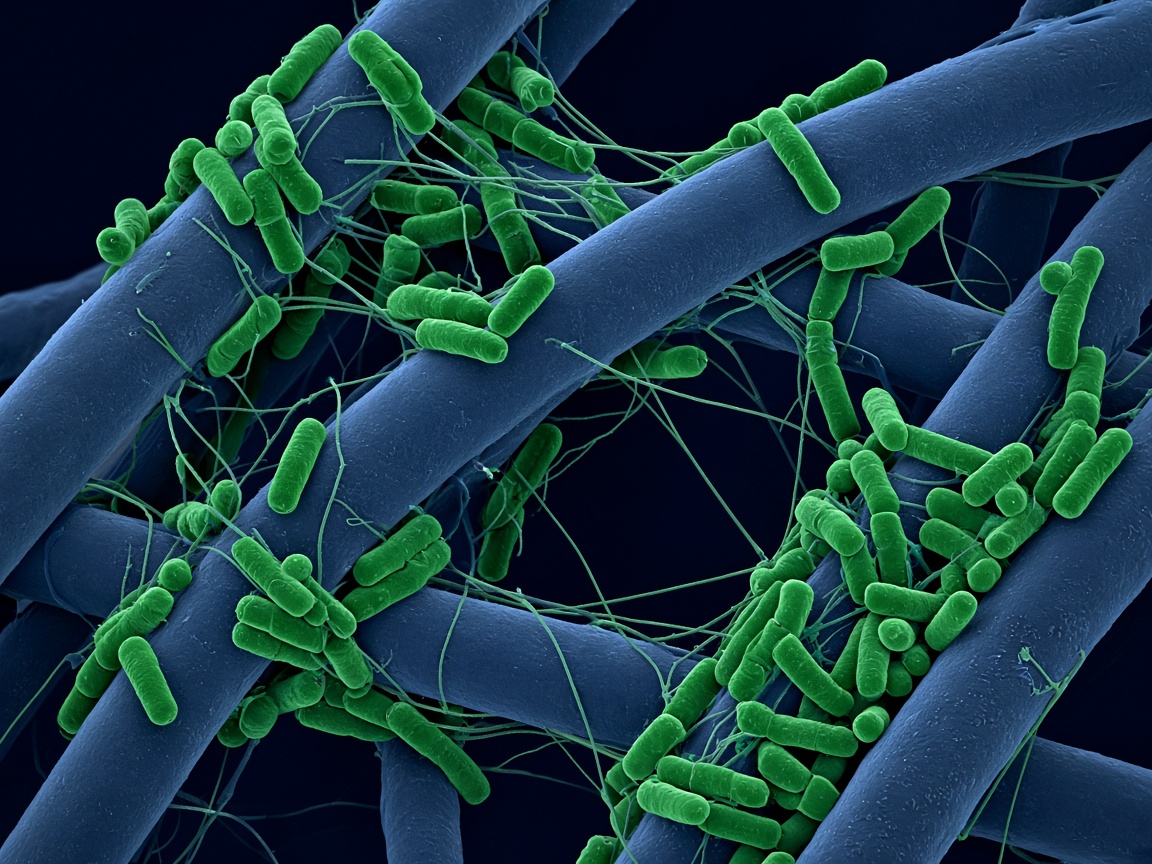
Bacteria such as Geobacter pass electrons to the anode through conductive protein nanowires. BioVolt measures that flow, mirrors it in a twin and decides what to do next.
// Faraday: charge carried by one gram of COD
Q = 4F / 32 = 96485 / 8 ≈ 12,061 C/g
// Coulombic efficiency
CE = ∫I dt / (Q · V · ΔCOD)

Layer 1
Measure
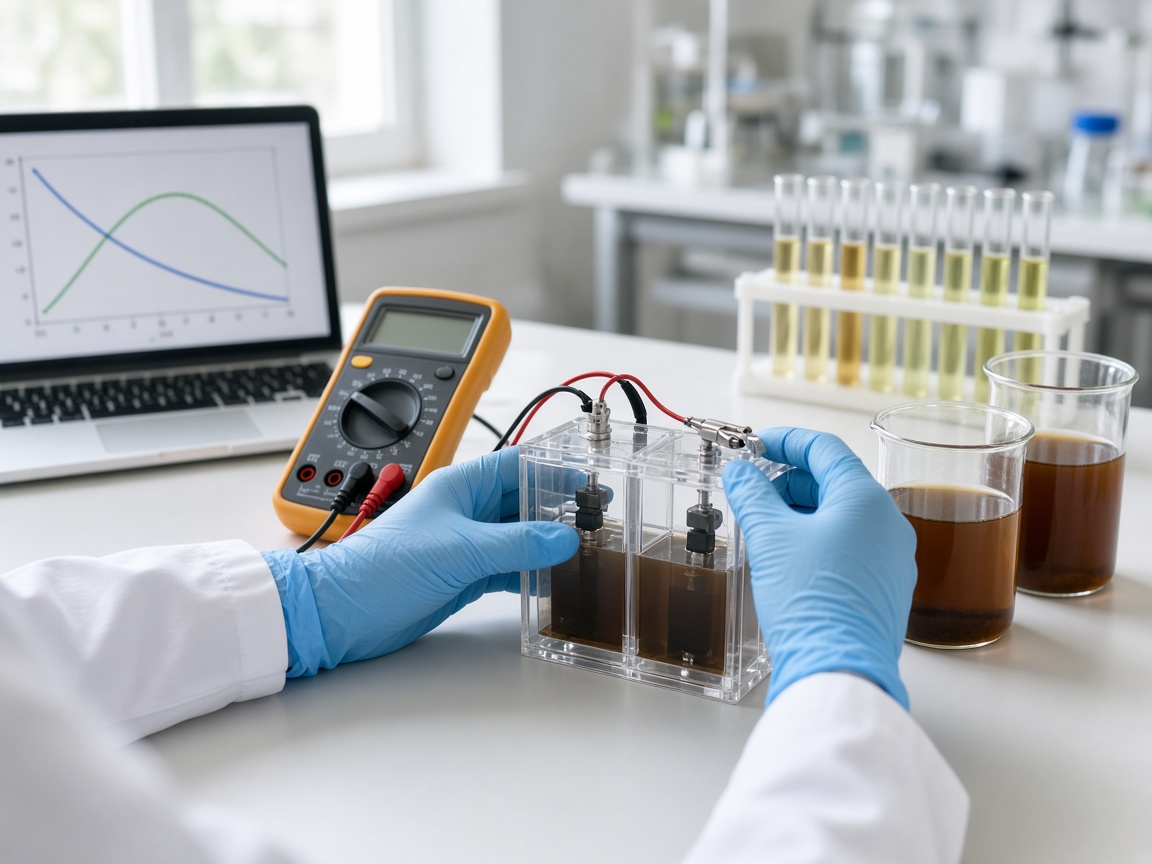
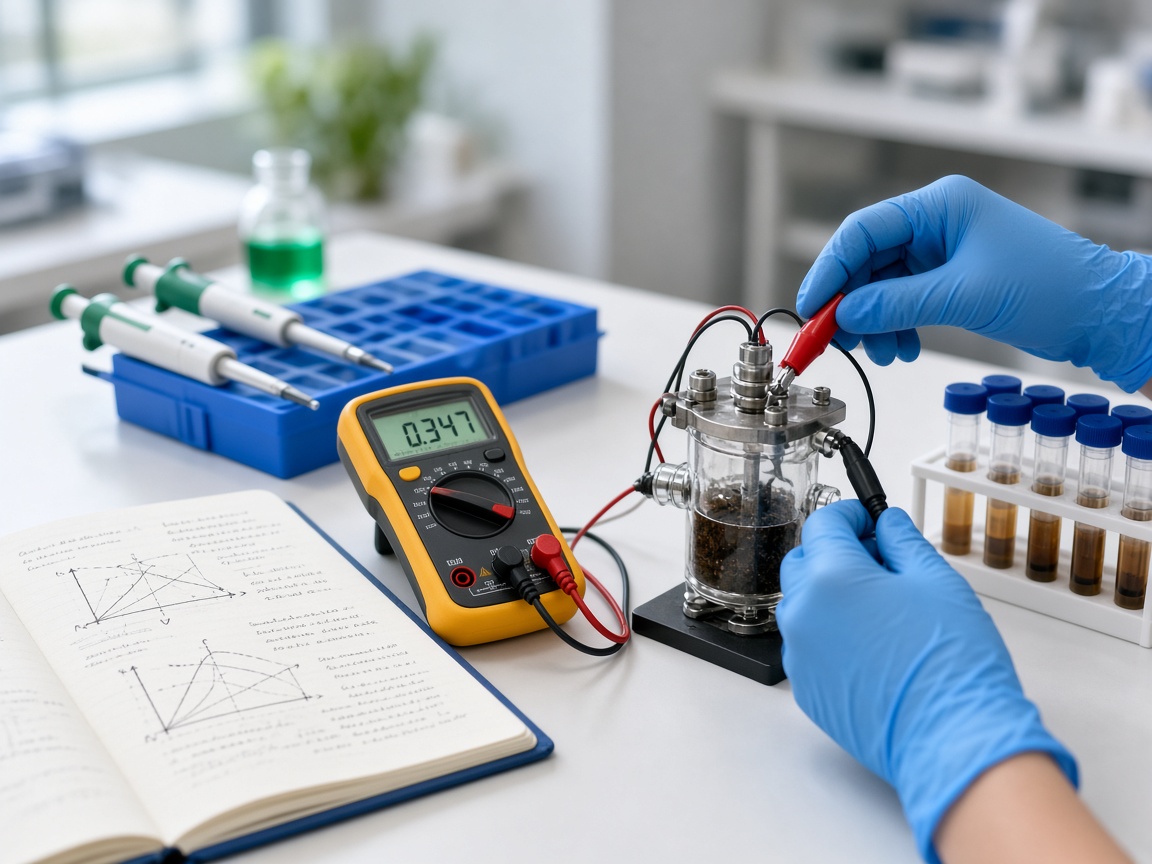
Voltage, current, anode potential, pH, temperature, conductivity and oxygen, sampled every few seconds by an ESP32 and a 16-bit converter.
P = V · I · j = I / A
Layer 2
Twin
A mechanistic model built only from physical laws and published kinetics: Nernst-Monod bacteria, biofilm growth, mass balance and the circuit.
q = qmax · S/(Ks+S) · f(E)
Layer 3
Decide
The AI compares reality with the twin, detects drift, tests actions on the twin first, then acts through a hard safety layer.
r = y − ŷ → act if safe
Coverage
Every sentence of the idea, traced to evidence
We took the BioVolt pitch apart line by line and asked one question of each: where is it proven? Tap a claim to see the verdict.
0/11claims supported, each with its limits stated openly
Validation
Checked against experiments, with no tuning
The model's constants come from the literature and were never fitted to these results. Where it misses, it misses on the cautious side.
Measured BioVolt model
Open circuit voltage0.804 vs 0.798 V
Liu, Cheng, Logan 2005
Max power, Rint ≈ 1286 Ω32 vs 38 to 40 mW/m²
Min, Cheng, Logan 2005
Bacterial doubling time7.5 vs 6 to 8 h
Bond & Lovley 2003
Max current, mature biofilm7.2 vs 8.3 to 11.5 A/m²
Lee 2009; Torres 2008
Coulombic efficiency9 to 26 vs 10 to 30 %
Liu & Logan 2004
Start-up: a biofilm matures in about two weeks
25 cm², 250 mL, 500 mg/L COD, HRT 24 h, 30 °C, pH 7
The best load is about 300 Ω
Power after stabilisation. This is the point the AI must find by itself.
222 µW
CE 26% · COD 33%
278 µW
CE 18% · COD 30%
257 µW
CE 14% · COD 29%
198 µW
CE 9% · COD 27%
Smart load control, measured on real cells
Our +36.5% is a simulation. These laboratory results are why we expect it to hold.
≈ 5×
more charge with automatic load control
1600 C vs 300 C; coulombic efficiency 15 to 23% vs 3 to 4% on a fixed 200 Ω load
Premier et al. 2011
+40%
coulombic efficiency with MPPT
Start-up about one month shorter on swine wastewater, with less methane
Molognoni et al. 2014
min
MFCs respond in minutes, not milliseconds
Why BioVolt's tracker steps slowly, every ten minutes, instead of like a solar panel
Woodward et al. 2010
Every equation above runs live in the Calculation Lab, with your own inputs.
Open the Calculation LabOut of the lab
What real pilots actually achieved
The honest picture: MFCs will not power a city. Their value is treating water with far less energy while producing a little electricity and running themselves.
kWh / m³
Chemical energy locked in wastewater1.7 to 2.1
Energy a conventional plant spends≈ 0.3
Electricity an MFC pilot recovered0.033
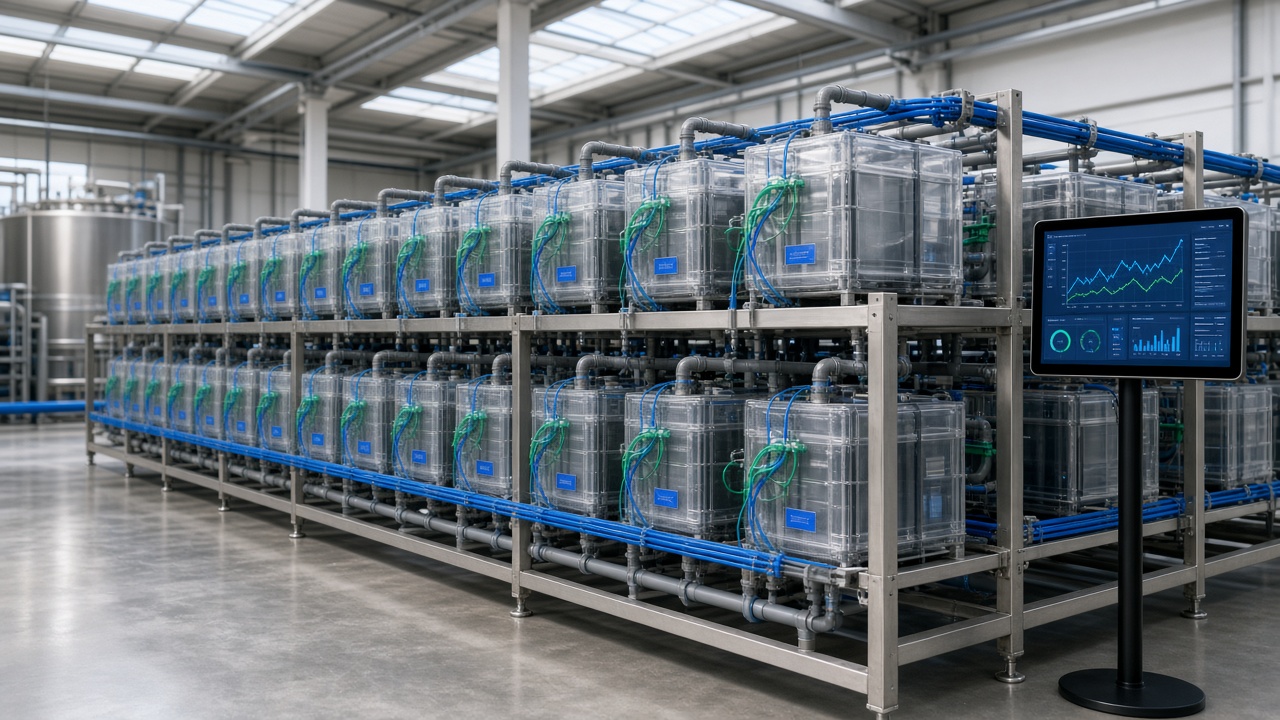
Liang et al. 20180.033 kWh/m³
1000 L, 50 modules, over a year
70 to 90% COD removal
Ge & He 2016+0.003 to 0.006
200 L, 96 tubular modules
Net energy positive, COD removal above 75%
He et al. 20190.002 kWh/m³
1.5 m³ system
91% COD removal; aeration used only 12% of activated sludge
PEE POWER 2016300 mW
432 cells, 300 L of urine
Lit festival toilets at Glastonbury
Disturbance and recovery
Detection speed decides the outcome
The same fault can be fully reversible or permanent depending on whether it is caught within minutes. First what laboratories measured, then what our simulation shows.
Low-pH shock, 17 cells
Power fell 52.7%
60.7 h on average; 3 cells never recovered
Lesnik, Cai, Liu 2020
Acidification
Largest loss of all failure modes
Current stabilised after about 115 h
Satinover, Rodriguez, Borole 2020
Salt shock
5.3 to 4.4 A/m²
Fully reversible within 48 h
Satinover et al. 2020
Aeration and voltage reversal
Negligible if caught early
Full recovery if caught in under 15 minutes
Satinover et al. 2020
Starvation
Current falls to background
Acetate: immediate. Glucose: about 1 day
Saheb-Alam et al. 2019
Voltage reversal in stacks
Cell collapse
Auto reconfiguration doubled power
Papaharalabos et al. 2017
Simulation: energy lost over 10 days
Validated 250 mL cell, mature biofilm, disturbance on day 2. Recovery = back to 90% of normal power.
| Disturbance | Fixed 1000 Ω | MPPT only | MPPT + freeze | BioVolt AI |
|---|---|---|---|---|
| Mild acid, pH 5.0 for 12 h | 0.6% no loss | 0.7% 14 h | 0.7% 14 h | 0% no loss |
| Severe acid, pH 4.0 for 24 h | 11.9% 45 h | 40.2% 134 h | 12.6% 46 h | 0% no loss |
| Cold, 15 °C for 24 h | 0.9% 25 h | 1.2% 25 h | 1.2% 25 h | 0.1% no loss |
| Starvation, no food for 24 h | 1% 27 h | 1.9% 28 h | 1.9% 28 h | 1.9% 28 h |
| Overload, COD 1500 for 24 h | +0.5% no loss | +0.6% no loss | 0% no loss | 0% no loss |
Lowest pH, severe shock
5.10 vs 6.78
Max power drop
100% vs 1%
10 calm days, MPPT vs fixed
231.3 J vs 169.4 J +36.5%
Six lessons the AI was built on
01
Prevention beats recovery
The AI held chamber pH at 6.78 during the severe shock. Without it pH fell to 5.10, below the bacteria's minimum of 5.85.
02
MPPT needs a safety layer
With zero power the tracker drifts to 20 Ω and gets trapped. Recovery took 134 h instead of 45. Freezing it restores 46 h.
03
Max power spends the margin
Drawing the most current uses the bacteria's spare capacity, so the objective must weigh power against resilience.
04
The AI cannot create food
In starvation every mode recovers 3 to 4 h after feeding resumes. The AI's job there is protection.
05
Every action costs energy
Heating 250 mL against 15 °C needs about 2.2 W, roughly 815 times the cell's 10-day output. Do not heat small cells.
06
Mature biofilms are robust
Bacteria run at a small fraction of capacity, so mild shocks barely move power. Young biofilms are more fragile.
Honest note. We found no published experiment that directly measured a feedback controller shortening MFC recovery after a real disturbance. The recovery claim rests on the caught-early evidence and on simulation, and it should be verified on the bench.
Standards
When does it earn the name digital twin?
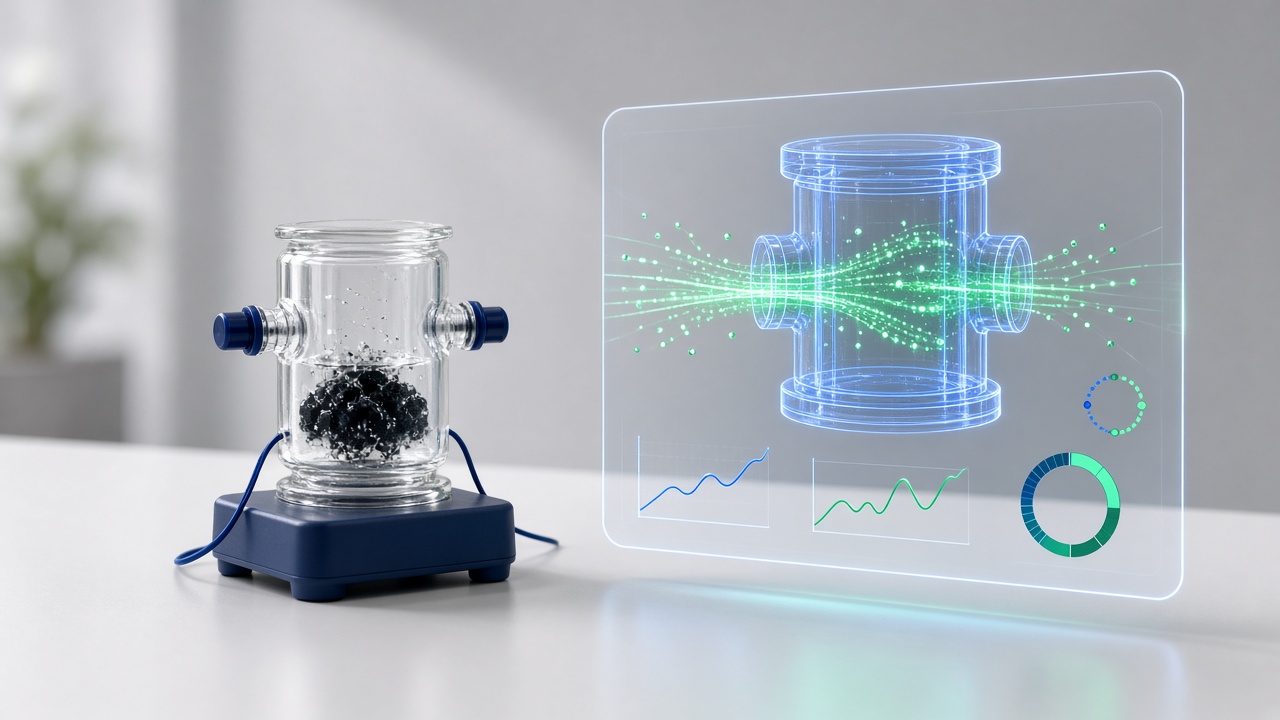
Kritzinger et al. (2018) define three levels by how data flows. BioVolt only becomes a true twin at level three, when the model's decisions return to the cell automatically. Until then a prototype is honestly a digital shadow.
1
Digital model
No automatic data exchange; data entered by hand
BioVolt: The website simulation today
2
Digital shadow
Automatic one-way flow: the cell updates the model
BioVolt: Sensors, logging and auto calibration
3
Digital twin
Automatic two-way flow: decisions return to the cell
BioVolt: Plus automatic actions: load, dosing, pump
Mapped to ISO 23247
Terminology: ISO/IEC 30173Observable element
The microbial fuel cell
Device communication
ESP32, sensors, resistor bank, pumps, heater
Digital twin
Mechanistic model, Kalman filter, what-if engine, AI
User
Website dashboard and decision log
Life-cycle view
Is it really clean energy?
Life-cycle studies give a conditional yes. The honest claim is electricity recovered from waste with lower treatment energy. Clean materials are a condition, not a detail.
- The CO₂ released is biogenic, short-cycle carbon from waste, not fossil fuel
- A well-run cell avoids methane and aeration energy
- Platinum, Nafion and carbon cloth can cancel the benefit
- Never call it zero-emission power
Foley et al. 2010
For industrial wastewater, an MFC gave no significant environmental benefit over anaerobic treatment with biogas. The result depends heavily on materials and performance.
Miwornunyuie et al. 2025
A constructed wetland had the lowest footprint. Adding an MFC to it gave the best treatment plus 2.68 kWh of electricity.
142.26
kg CO₂-eq
$627
wetland /m³
$718
with MFC /m³
6SDG
Clean water
Treatment with little aeration energy
7SDG
Clean energy
Electricity recovered from waste
9SDG
Innovation
Digital twin and AI for bioprocesses
11SDG
Sustainable cities
Decentralised treatment, self-powered sensors
12SDG
Responsible production
Food waste becomes a resource
13SDG
Climate action
Less aeration energy and methane
Scientific honesty
What the model does not do
A model is only trustworthy if its limits are written down. These are ours.
- Faraday, Nernst, Ohm and conservation of mass and electrons are exact.
- Biological constants have published ranges, not single values. Every real cell needs calibration, which is the twin's job.
- Temperature limits, pH coefficients, membrane oxygen permeability and cathode exchange current are fitted or catalyst-dependent.
- The model is one-dimensional: no concentration gradients inside the biofilm (an accepted simplification, as in Pinto 2010).
- pH is modelled as mixing without buffer chemistry. Real buffers soften shocks; protons in the biofilm can sharpen them.
- The recovery simulation has no stress-induced death, so real severe shocks can take longer to recover from.
- The hydrolysis constant varies by orders of magnitude between systems and must be calibrated for each waste.
- Human-intervention frequencies are design targets, not measurements.
Safety
Build it safely
Living systems and automation both need care. The safety rules run on the device, so they hold even if the network fails.
Pathogens in wastewater
BSL-2 practice: gloves, eye protection, disinfection. Schools use soil and synthetic medium at BSL-1.
Hydrogen sulphide
Toxic gas: sealed cells, ventilation, never smell the chamber.
Methane and hydrogen
Flammable: vent the headspace, no flames nearby.
Charged capacitors
Cell voltage is safe, but capacitors can deliver large short-circuit currents.
Chemicals
Buffers and weak acid: standard handling and labelling.
Automated actuators
Hard limits on the device, a manual stop, every action logged.
Never use real wastewater without supervision and BSL-2 practice.
References
80 sources, every one checkable
Search by author, year, journal or DOI. Every DOI opens the original paper.
80
- 1
Logan, B.E., Hamelers, B., Rozendal, R., et al. (2006). Microbial fuel cells: methodology and technology. Environ. Sci. Technol. 40(17):5181-5192.
doi:10.1021/es0605016 - 2
Logan, B.E., Regan, J.M. (2006). Microbial fuel cells - challenges and applications. Environ. Sci. Technol. 40(17):5172-5180.
- 3
He, Z. (2017). Development of microbial fuel cells needs to go beyond "power density". ACS Energy Lett. 2:700.
doi:10.1021/acsenergylett.7b00041
From paper to prototype
Read it, run it, then build it
The full research is available in English and Arabic. Try every claim yourself in the simulation and the AI monitor before touching a single wire.